Rocky 3.8
SDR software for the SoftRock radio
FREEWARE
Advanced Topics
Tools and components
Rocky was written in Delphi 5 Pro.
The development cycle was pretty short since I used a lot of code
from my weak signal decoder project. I have been working on that project
for the last 5 years, and now it is very close to completion - but I am so tired
of it that I am starting smaller projects, like
MorseRunner
and Rocky, to have an excuse for not working on the decoder ;-)
Audio I/O
Rocky talks directly to the WDM driver of the sound card. This ensures the
lowest possible latency, eliminates a number of problems associated with the
Windows K-Mixer, and allows smooth audio streaming between two souncards. However,
the WDM-based approach has some disadvantages, too: 1) the program does
not work on the old versions of Windows;
2) the sound card can be opened only at the sampling rates directly supported
by the driver, since the program cannot take advantage of sampling
rate conversion in K-Mixer.
Update: Rocky 3.8 and later versions use
WASAPI instead of WDM.
Band Scope
The polyphase FFT algorithm is used to calculate the displayed spectrum.
The screenshots below
show the difference between the standard FFT and polyphase FFT: the latter has
much higher resolution and does not introduce extra spectral leakage.
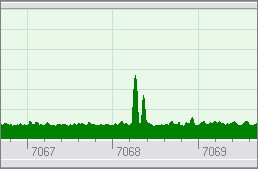
Standard FFT
|
Polyphase FFT
|
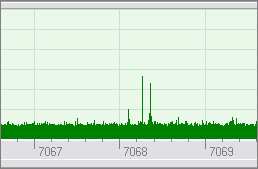
Non-linear filtering is applied to the power spectrum before
it is displayed. This improves the signal-to-noise ratio and makes weak signals
clearly visible in the noise. The filter is always turned on in the program, but I
temporarily disabled it in the code to take the screenshot presented below.
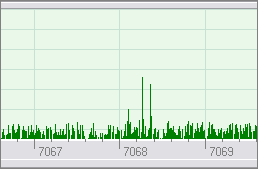
Filter disabled
|
Filter enabled
|
The filter is just a 1-st order lowpass IIR filter:
FilteredSpectrum[i] := FilteredSpectrum[i] * (1-Gain) + NewSpectrum[i] * Gain;
- except that the gain is a non-linear function of the amplitude:
Gain := (1 - Exp(-(0.2 * NewSpectrum[i])));
Due to this non-linearity, the time constant of the filter is high for
the noise but close to zero for the strong signals.
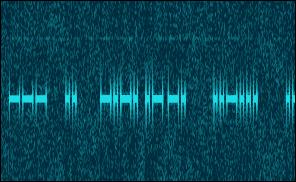
Waterfall Display
While the spectrum display has high resolution in frequency, the waterfall
display is designed to have high resolution in time, so that CW signals
can be copied visually at the speeds up to 40 WPM. How many
callsigns can you read on the screenshot below?
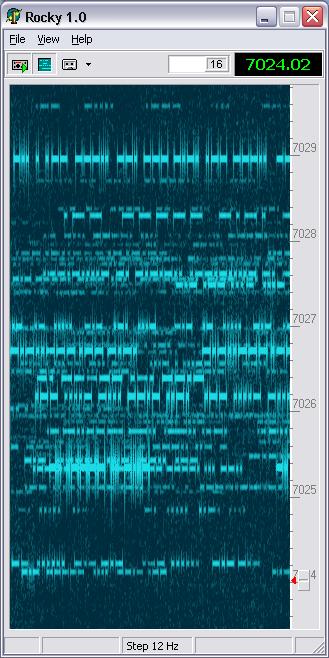
A pileup on the K7C frequency
Two optional filters are available in the waterfall display mode. The filters
can be enabled or disabled using the drop-down menu of the Waterfall Display button.
Key-click filter removes CW key clicks.
It is implemented as spectral subtraction: the estimate of the power density of
the key clicks is subtracted from the power spectrum of the signal. The filter
also has some de-noising effect.
Key-click filter disabled
|
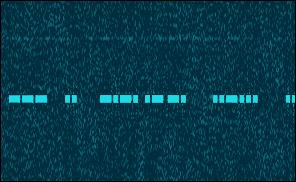
Key-click filter enabled
|
Super Resolution filter is based on the transform
known as time-frequency surface re-parameterization.
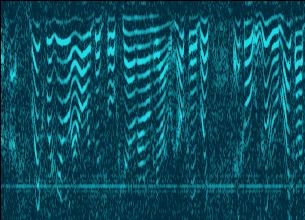
Standard resolution
|
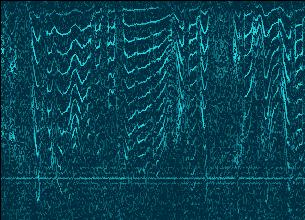
Super resolution
|
A modified version of the third party FFT unit from the
DC-DSP Component Pack
is used in Rocky to compute the Fast Fourier Transform.
I have fixed a couple of bugs in this unit and modified it for compatibility with Delphi 5.
The source code of the updated unit is available in the
Programmer's Corner.
I/Q Balancing
I/Q Balancing in Rocky is fully automatic and does not require any lab
equipment, all you have to do is start the program when the band
is open. Rocky will use all strong stations on the band as signal generators!
The algorithm works as follows.
The power spectrum is scanned for the signals
that are at least 30 dB above the noise.
For each signal, synchronous detection of the image is performed using
the main signal as a reference oscillator. The synchronous detector has very high
sensitivity and can detect the image signal even if it is below the noise.
For the signal in the j-th bin of the spectrum,
the normalized output Z of the syncronous detector is calculated as follows:
      Z = ComplexMul(ASpectrum[j], ASpectrum[FftSize-j])
      Pwr = Sqr(ASpectrum[j].Re) + Sqr(ASpectrum[j].Im) +
            Sqr(ASpectrum[FftSize-j].Re) + Sqr(ASpectrum[FftSize-j].Im)
      Z.Re = Z.Re / Pwr
      Z.Im = Z.Im / Pwr
Z is a complex value that contains information about the amplitude and phase of the
image in respect to the main signal.
The program averages Z over the time and calculates the amplitude and
phase error as a function of frequency:
      tmp = Sqrt(1 - Sqr(2*Z.Re))
      Phase = ArcSin(2*Z.Im / tmp)
      Gain = tmp / (1 - 2*Z.Re)
I have derived these equations using the Maxima tool.
Rocky interpolates the error estimates by fitting a polynomial to them,
and constructs a frequency-domain error function, H[w]:
      H[w].Re = Gain[i] * Cos(Phase[i])
      H[w].Im = Gain[i] * Sin(Phase[i])
The spectrum S'[w] of the input signal is transformed to obtain the corrected
spectrum S[w] using the following equations:
      S[w].Re = S'[w].Re + S'[-w].Re
        - (S'[w].Im + S'[-w].Im) * H[w].Im
        + (S'[w].Re - S'[-w].Re) * H[w].Re

      S[w].Im = S'[w].Im - S'[-w].Im
        + (S'[w].Im + S'[-w].Im) * H[w].Re
        + (S'[w].Re - S'[-w].Re) * H[w].Im
Click on View / IQ Balance in the menu to see the plots of the phase
and amplitude errors vs. frequency. They should look like this:
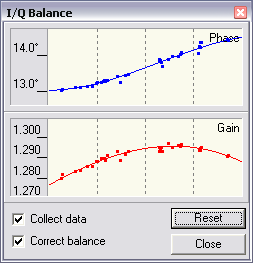
15 min. after start
|
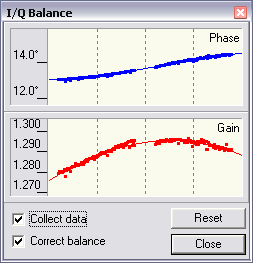
Next day
|
I have an old version of SoftRock40, the one without the mod to the Johnson counter.
The new versions probably have much smaller errors due to better timing
of the LO signal.
Multirate filtering
The main filter in Rocky is a classical windowed-sinc filter. Since the
bandwidth of the filtered signal never exceeds 3 KHz, it makes sense to do
filtering at a lower sampling rate: this saves a lot of CPU cycles.
The desired segment of the spectrum is mixed down to baseband and
re-sampled at 6 KHz, the filter is applied, and the filtered signal is mixed with
a complex sinusoid to produce the desired pitch. Mixing, re-sampling and filtering
are performed in the frequency domain. The program tries to open the sound
card for output at the 6 KHz sampling rate. If this fails, it up-samples the signal
to whatever sampling rate is supported by the sound card.
Filter parameters
Bandwidth
The bandwidth of the main filter is adjustable between 20 Hz
and 600 Hz. What bandwidth should you use? In the classical, all-hardware
CW receivers, the 500 Hz bandwidth is the standard: a narrower filter would make
it difficult to find stations on the band and tune precisely at the signal.
This is not a limitation in a software-defined radio: all stations,
even the weakest ones, are clearly visible on the spectrum and waterfall
displays, and precise tuning at the station can be performed with a single
mouse click. Now you can use very narrow filters with ease.
For a CW signal, the optimal bandwidth in terms of SNR in white noise is
1.5 * WPM - e.g., 45 Hz for a 30 WPM.
Under heavy QRM, even narrower filters should be used: you will have a bit
lower signal-to-noise ratio but much better signal-to-interference ratio.
When you start using narrowband filters in Rocky, you will appreciate the Snap
function. Tuning at a signal manually with a 20-Hz filter is a nightmare!
Shape factor
The shape factor is a ratio of the filter bandwidth at -60dB and -6dB. One might
think that the closer the shape factor to 1 the better. Wrong! Filters with
very small shape factors inevitably ring - not because of poor design, but
due to the Gibbs phenomenon. The only way to eliminate ringing is to increase
the shape factor.
The shape factor can be calculated from the transition bandwidth of the filter
as follows:
ShapeFactor = (TransitionBW + Bandwidth + TransitionBW) / Bandwidth.
Rocky allows you to select one of several pre-defined transition bandwidths,
the choice is presented as a shape factor at the 500 Hz bandwidth. This feature
was added only for experimentation. For everyday operation, use the Auto Select
option - this tells Rocky to maintain the optimal shape factor at any
filter bandwidth.
Exercise. Select the filter shape factor of 1.02, disable AGC,
and set the 500 Hz bandwidth.
Tune at a strong, high-speed CW signal so that its frequency is close
to the filter cutoff frequency. You will hear strong ringing
that starts a fraction of a second before the main signal, and gradually fades out
after the end of the signal.
AGC
The AGC algorithm in Rocky maintains the optimal dynamic range of the output signal.
This is different form the classical AGC systems that care only about
the upper end of the dynamic range. Such 'two-sided' AGC has the right gain
both during and in between the strong signals
and allows the operator to hear weak stations between the dots and dashes of the strong ones.
The algorithm estimates the input noise r.m.s. from the spectrum of the unfiltered signal, and computes
the envelope of the total (signal + noise) signal. These two values define the
input dynamic range. AGC maps this range to the desired
output dynamic range with an exponential function:
Out = MaxOut * (1 - Exp(-In / Beta))
The output signal of the AGC unit is a product of the input signal and the AGC gain
as a function of time. In the frequency domain, this is equivalent to the
convolution of the input spectrum and the spectrum of the gain function.
Therefore, AGC adds sidebands to the spectral peaks of the signal - this effect
is known as intermodulation. Since the sidebands are just copies of the gain spectrum,
intermodulation can be minimized by ensuring that the gain function is as narrowband
as possible. This is acheived by lowpass-filtering the gain.
The gain filter consists of a sliding minimum filter followed by the Blackman FIR filter.
The length of both filters is the same, this ensures that the filtered gain
does not exceed the instant gain calculated from the mapping function, and thus
clipping never occurs.
S-Meter
The S-meter in Rocky is an attempt to see if SDR software can do
better than just simulate the behavior of a hardware device. An analog
S-meter is usually based on a peak detector with exponential decay. The
S-meter in Rocky works differently: it tracks the envelope of the signal
using the sliding minimum algorithm, and displays the true signal strength
with a 0.3 s resolution in time. As a result, the indicator does not jump at
each dot and dash or voice burst, and the reading changes only when the signal strength
actually changes.

The variations of instant power under the envelope are shown on the S-meter
with white dots around the marker, each dot is 6 dB or 1 S unit. In the SSB
mode, you can estimate the peak factor of the signal by looking at those dots;
for a CW signal the dots show the difference in power between Morse
elements and spaces between them (that is, the true SNR).
CW Transmitter
The CW signal is generated in the time domain as a complex sinusoid multiplied by
the keying envelope. The algorithm of the envelope generation is described in
my article, CW Shaping in DSP Software,
QEX May/June 2006.
The rise and fall time of the envelope is 5 ms; the algorithm ensures that
the keying sidebands are suppressed by more than 100 dB{!} at +/-280Hz from the carrier.
The spectrum of the I/Q output signal is shown below:
The SSB TX mode is work in progress. The speech pre-processing module
is ready for testing, it is currently available as a
stand alone program.
BPSK31 unit
Receiver
The input to the BPSK31 receiver is a complex baseband signal sampled at 3000 Hz.
This is the same signal that is used in the CW and SSB filters, see
Multirate Filtering above for details. The receiver consists of the following
modules.
LO / Mixer
multiplies the input signal by a complex sinusoid to cancel the frequency error.
On startup, the frequency of the LO is zero.
LPF / Resampler
performs lowpass filtering and downsampling. Filtering is done in the frequency domain.
The filter has two bandwidth settings, 30 Hz and 17 Hz. The wider filter is a
standard Blackman-Sinc FIR filter, the narrow one is a custom filter optimized
for minimum ISI, designed in
SciLab.
The wide filter is used for frequency acquisition. Once the frequency lock
is achieved, the narrowband filter is switched in.
Downsampling is also performed in the frequency domain,
by aliasing the spectrum onto itself. The output sampling rate is 375 Hz.
Frequency Detector
multiplies the current
audio sample by the complex conjugate of the previous sample. The argument of the
product is the frequency error, is radians per sampling interval, and the
magnitude is the instant power of the signal.
Frequency tracker is a 1-st order Kalman
filter. Its inputs, the observation value and variance, are computed from the
argument and magnitude of the frequency detector output. The frequency
estimated by the Kalman filter is negated and assigned to the LO.
Sybmol Timing Tracker estimates the
period and time offset of the symbols. The instant power of the BPSK signal is a
constant (subject to fadings), with occasional nulls occurring when the signal
phase is reversed. These nulls occur at the sybmol boundaries and have a
cosine shape. The symbol tracker computes a complex correlation of the signal
power with one period of the cosine, the phase of the result is the time
offset of the null from the origin of the cosine. A second order Kalman filter
tracks the timing error and provides an estimate of the symbol transition time.
Symbol Sampler / Phase Corrector
uses the timing information from the symbol tracker to sample the data at the
symbol centers. DPSK demodulation is performed by computing the phase difference
between two successive samples. Ideally, the result should be either 180°
or 0°. If it is different from those values, a Kalman filter tracks the error
and subtracts it from the output.
Varicode Decoder
accumulates the bits coming from the symbol
sampler in the buffer until a 00 combination is received,
then it decodes the bits into a
character by table lookup and dumps the buffer.
Transmitter
The BPSK31 transmitter consists of the PSK Keyer and a mixer.
PSK Keyer
receives characters to be transmitted, encodes them using the Varicode table,
and generates the baseband BPSK31 signal. It also gnerates the preamble, post-amble,
and nulls (when idle).
The Mixer multiplies the baseband signal
by a complex sinusoid to shift it to the desired frequency.
Error correction in BPSK31
The QPSK31 mode has an error correction mechanism that
improves the accuracy of message decoding in the receiver. The input message is
encoded in the transmitter in a special way, and the transmitted sequence has
twice as many bits as the original message (50% redundancy). This redundancy
is then used in the decoder to correct the errors.
In the BPSK31 mode, no coding is performed at the transmit side. The Varicode
character codes are transmitted in their original form and decoded in
the receiver by simple table lookup.
Since all error correcting algorithms require redundancy, one might think that
error correction in BPSK31 is impossible. This is not true. There is a certain
amount of 'natural' redundancy in the messages typically sent by hams, due to
the fact that some combinations of characters occur more ofthen than
the others. I recorded a number of BPSK31 messages off the air (about 130,000
characters in total) and computed the redundancy for the pairs of characters.
To my surprise, the redundancy level was over 30%, more than enough to justify
an attempt to correct at least some errors.
Rocky 3.2 includes a BPSK31 error correction
function based on the character pair statistics. This function can be turned
on and off in the popup menu of the text display. When error correction is enabled,
the signal is first decoded with the standard decoder, and the ouput text is
printed in balck or gray, depending on the signal quality. About 1.5 seconds
later this text is replaced with the output of the error-correcting decoder,
and the characters, if corrected, change their color to pink.
Vector Network Analyzer
Paul N2PK, the author of N2PK Vector Network Analyzer (VNA),
has discovered that SoftRock RXTX could be used to measure
the complex impedance, reflection coefficient and VSWR of the device connected
to its antenna terminals since all
components that comprise a VNA were already present in the radio. He sent me his
equations, and I implemented them in Rocky under his guidance.
Using this software-defined VNA,
you can measure the parameters of your antenna and view their charts
vs. frequency in real time.
Paul has written an excellent
tutorial
tha covers all aspects of VNA calibration
and measurements, and describes the minor modifications in SoftRock requred to turn it into a VNA.
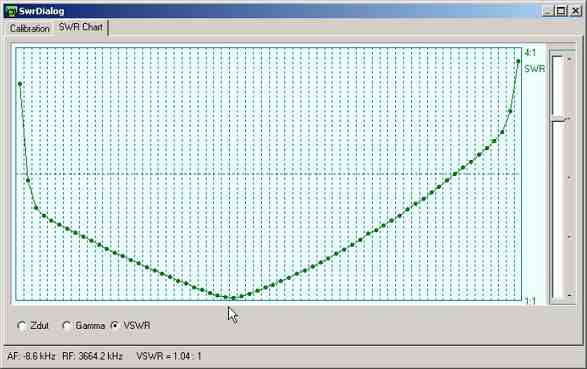
Screenshot by Bodo DJ9CS:
the VSWR chart of his short dipole for 80 m
Copyright © 1998-2020 Afreet Software, Inc.

|
