|
|
 |
Ham VNA 1.1
Vector Network Analyzer
for Win2000/WinXP/Vista/Win7, 32 and 64-bit.
FREEWARE
What It Is
Hermes,
an SDR RX/TX board designed by the
HPSDR team,
has many different uses. In particular, with the addtion of a simple
reflection bridge,
it becomes a Vector Network Analyzer, a powerful tool for analyzing the
antenna systems and radio circuits. The board comes with
Hermes VNA
software that implements the basic functions of data collection and display.
HamVNA presented on this page is an alternative to that program
that provides more functionality and a nice, easy to use interface.
HamVNA can display and analyze the data from two sources:
- collected using the Hermes hardware;
- collected on another VNA hardware and saved in the
TouchStone format
(*.s1p and *.s2p).
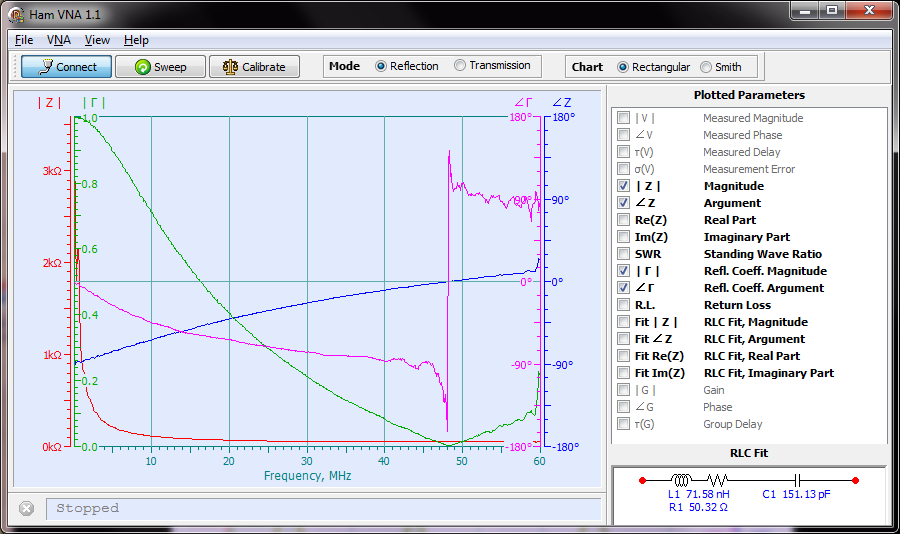
Fig. 1. The main window of HamVNA. Click to enlarge
Required Hardware
I have built and tested two fixtures that turn the Hermes board into a VNA, both designed by Sam Wetterlin:
the Series Fixture described
here
and the reflection bridge described
here. Both worked well.
I use the series fixture more often because it works both in the transmission and
reflection modes.
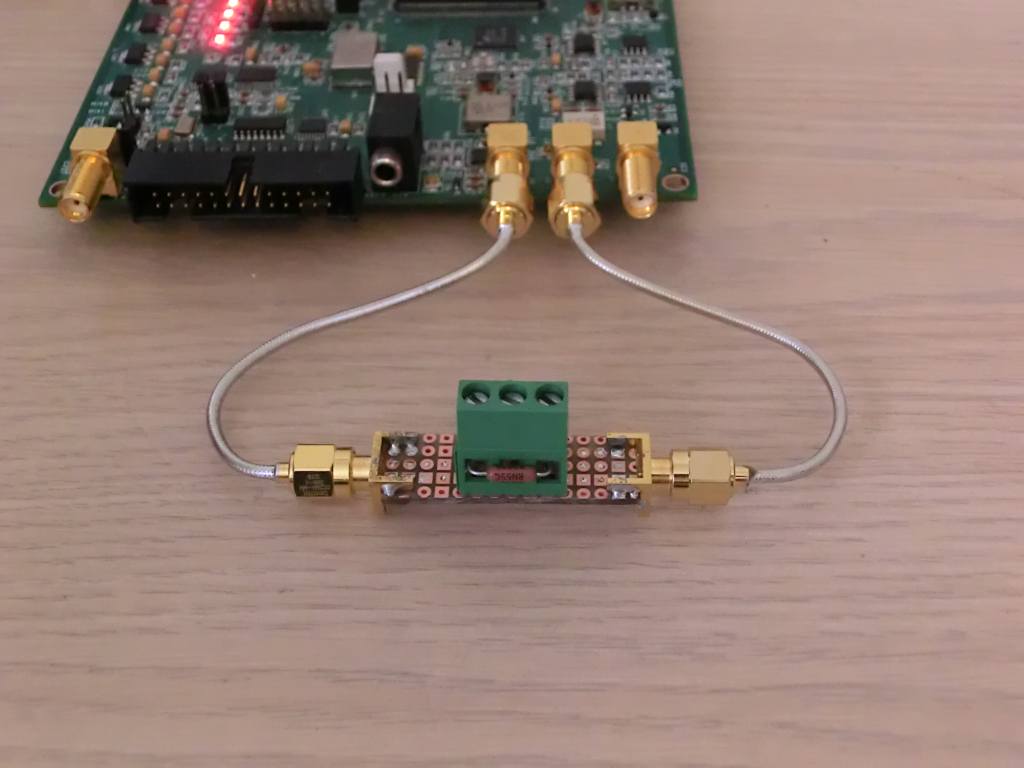
Fig. 2. The series fixture. Click to enlarge
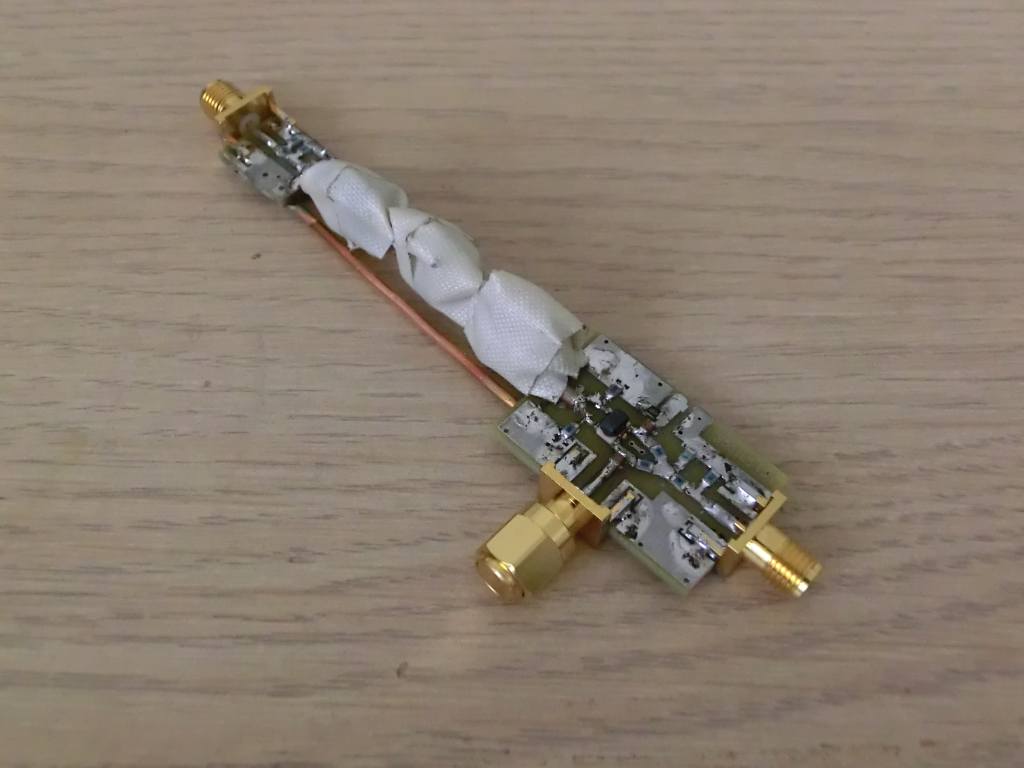
Fig. 3. The reflection bridge. Click to enlarge
How To Use It
To connect the software to the Hermes board, just click on the Connect button.
The connection process is automatic, if the board is not attached to the PC or
turned off, the program waits until the board becomes available, and then
connects. Click on the same button again to disconnect.
Click on the Calibrate button to access the calibration functions. The program
supports the standard Open-Short-Load calibration scheme in the reflection mode.
In the transmission mode, only the Short Circuit calibration is used.
To collect calibration data, perform three scans by clicking on the Open, Short
and Load 50 Ohms buttons, in any order, and connecting the corresponding standards
to the fixture. Calibration data may be saved to a file and later loaded back
in the program.
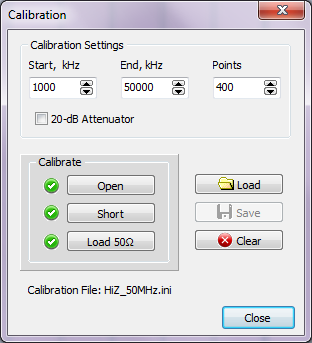
Fig. 4. Calibration dialog. Click to enlarge
Once the sytesm is calibrated, you can perform the measurements by clicking on the
Sweep button. The measured data are plotted eighter on the rectangular chart or
on the Smith chart. In the rectangular chart mode, up to 4 parameters may be
selected for display at the same time. The following parameters are available:
- | V |, ∠V, τ(V), σ(V): the magnitude, phase, group
delay and standard deviation of the measured signal. These raw data are useful
for troubleshooting the hardware;
- | Z |, ∠Z, Re(Z), Im(Z): the magnitude, argument, real and imaginary
parts of the DUT impedance;
- S.W.R., R.L: standing wave ratio and return loss;
- | Γ |, ∠Γ: magnitude and argument of the reflection
coefficient;
- Fit | Z |, Fit ∠Z, Fit Re(Z), Fit Im(Z): see the RLC Fit section;
- | G |, ∠G, τ(G): the magnitude, phase shift and group
delay of the DUT in the transmission mode.
- Fit | Z |, Fit ∠Z, Fit Re(Z), Fit Im(Z): see the RLC Fit section;
To zoom in the chart, place the mouse cursor over the area of interest and spin
the mouse wheel. Hold the Ctrl or Shift key down when spinning the wheel to zoom
only horizontally or vertically. When zoomed in, pan the chart by dragging it with the mouse.
RLC Fit
When the impedance data are measured or loaded from a file, the program
automatically generates an equivalent RLC circuit that has the same impedance
vs. frequency curve as the DUT. As far as I know, HamVNA is the only VNA program
on the market that can do this.
Here is an example of the RLC fitting function in action.The charts on Fig.1 were obtained by
measuring the impedance of a simple circuit consisting of a 50-Ohm, 1% resistor and
a 150-pF silver mica capacitor. Both elements had untrimmed, about 1" long leads.
The equivalent circuit generated for this DUT appears in the bottom right panel
of the HamVNA window, it consists of a resistor, a capacitor, and a small inductance.
As you can see, the inductance of the leads is only 0.07 μH, but it is not
negligible: it explains the series resonanse at 48 MHz observed on the chart.
The fitting function can generate the circuits of varying complexity. You can
control the complexity using the slider labeled Order that sets the order of the
fitting function.
An example of a more complex circuit appears on Fig.5-Fig.7 below. The DUT in this case
was my top-loaded vertical for 80 m, fed with a 40-m piece of RG-59. The thin solid lines
on Fig.5 represent the measured magnitude and argument of the input impedance of the antenna,
and the thick pale lines show the fitted function.
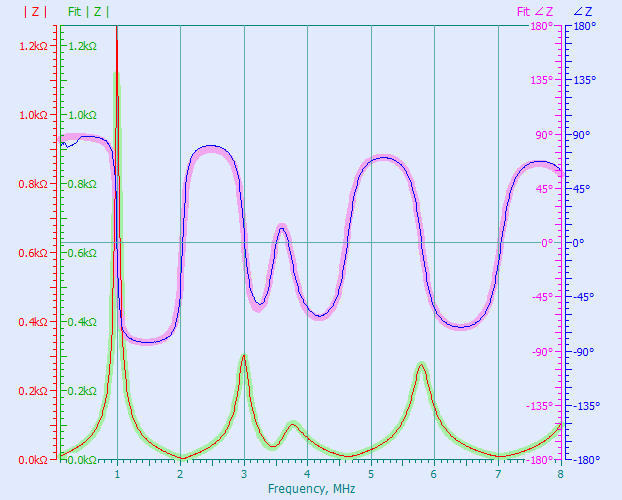
Fig. 5. The input impedance of the 80m vertical, and its RLC fit. Click to enlarge
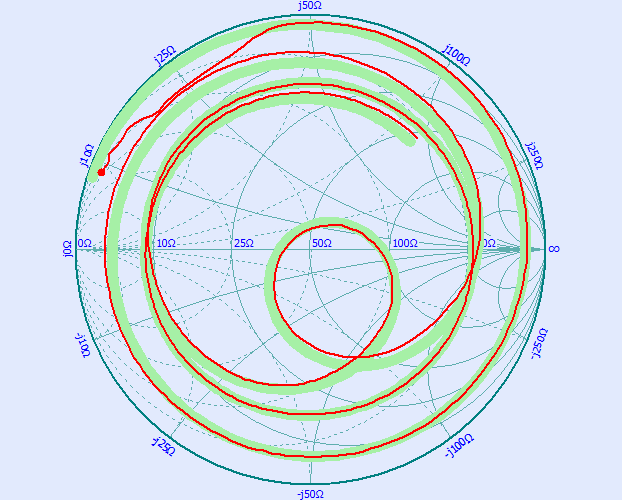
Fig. 6. The Smith chart of the 80m vertical, and its RLC fit. Click to enlarge
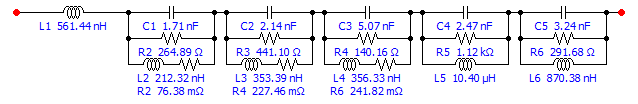
Fig. 7. The equivalent circuit of the 80m vertical. Click to enlarge
Remote calibartion
In the measurements described above, calibration was performed by connecting
the calibration standards directly to the fixture. This is not the only way of
doing the calibartion. The system could be calibrated with the standards connected
at the far end of the coax, to remove the effect of the coax on the measurements.
Fig.8 is the Smith chart of the same vertical, measured with remote calibaration.
Multiple circles present on Fig.6 that were caused by the coax are now gone, and the chart is much
easier to analyze. The equivalent circuit shown on Fig.9 is also much simpler.
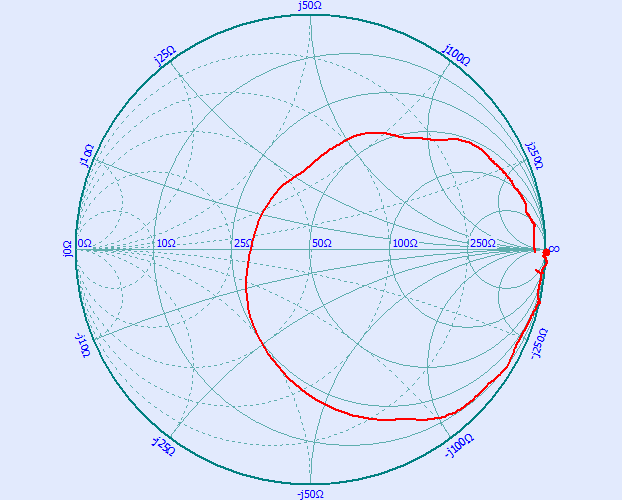
Fig. 8. The Smith chart of the 80m vertical, remote calibartion. Click to enlarge
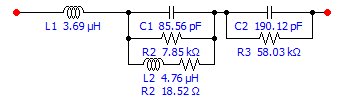
Fig. 9. The equivalent circuit of the 80m vertical, remote calibartion. Click to enlarge
Source Code
HamVNA is an open source project, its source code is distrubuted under the terms
of the MPL v.2.0 license.
Both installation package of the program and its source code are available on the
Downloads page.
Copyright © 1998-2020 Afreet Software, Inc.

|
|
|
 Downloads
 Registration
 Author's e-mail
|
